Visual Studio Code
On Tap Cloud DX supports remote development using VS Code.
Requirements
The following extensions are required:
- Remote Development - search for
ms-vscode-remote.vscode-remote-extensionpack - PHP Debug -search for
xdebug.php-debug
For information about how to install extensions from the Extension Marketplace, please review this documentation.
Connecting to your Cloud DX Server
-
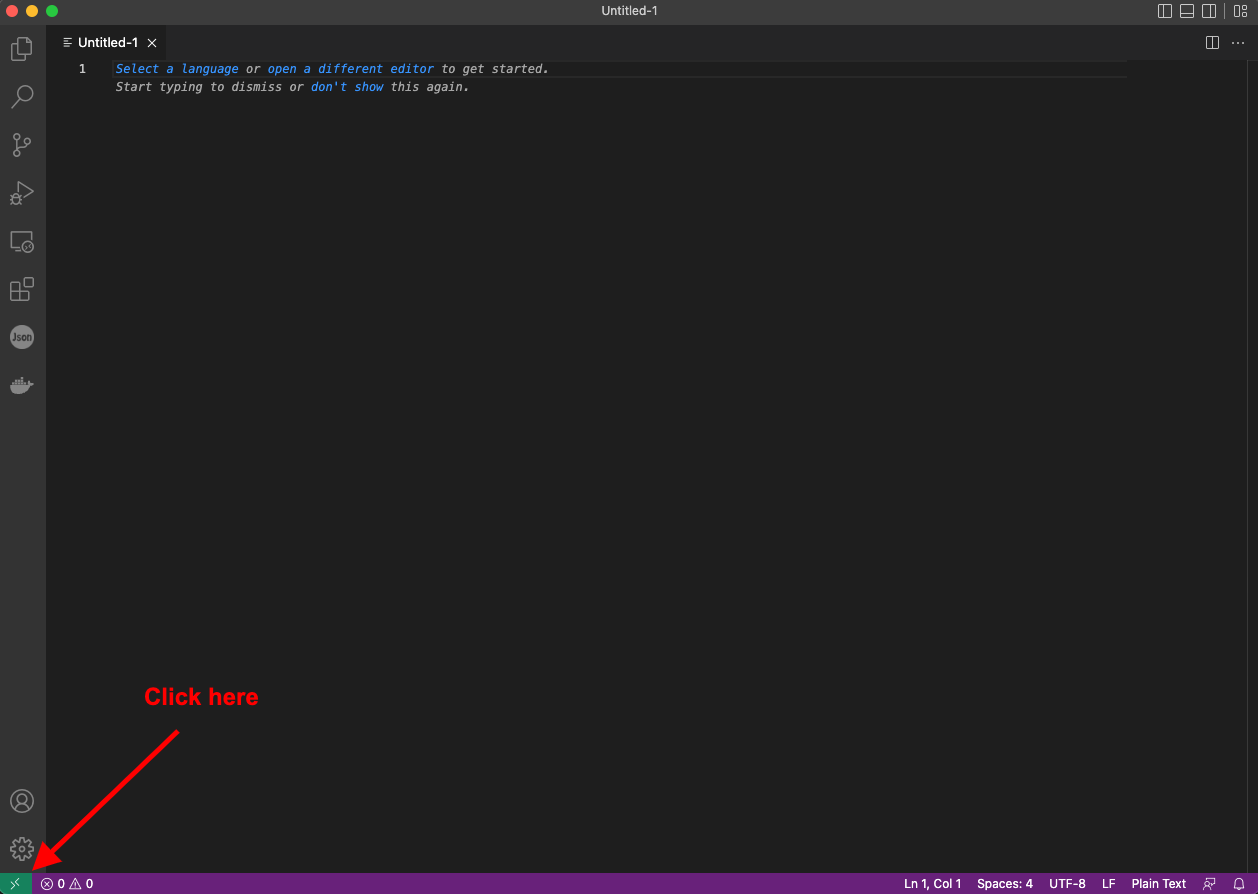
Open a new window in VS Code...
-
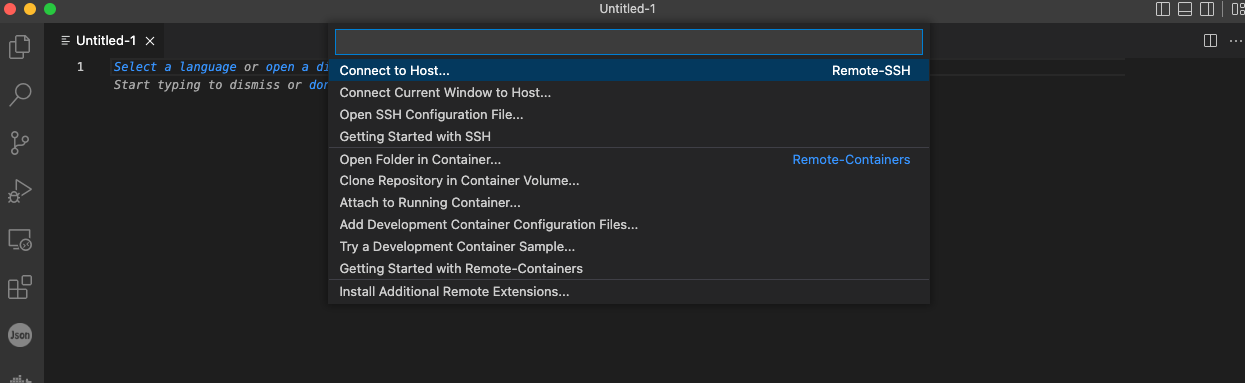
Select the "Connect to Host" option...
-
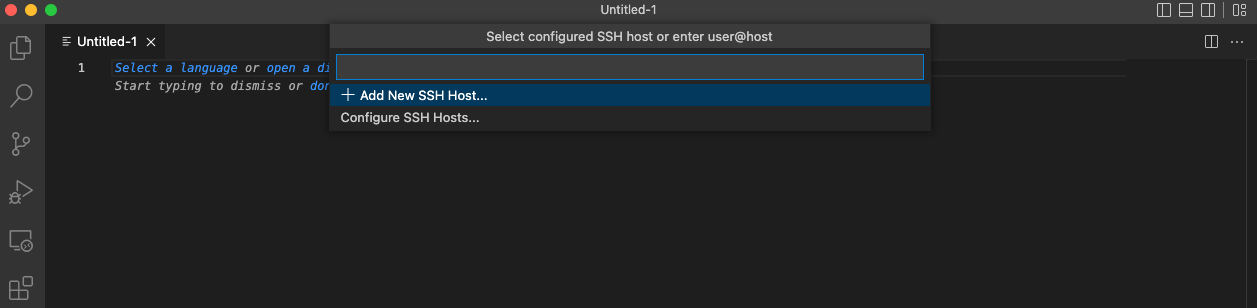
Click on the "+ Add New SSH Host..." option...
-
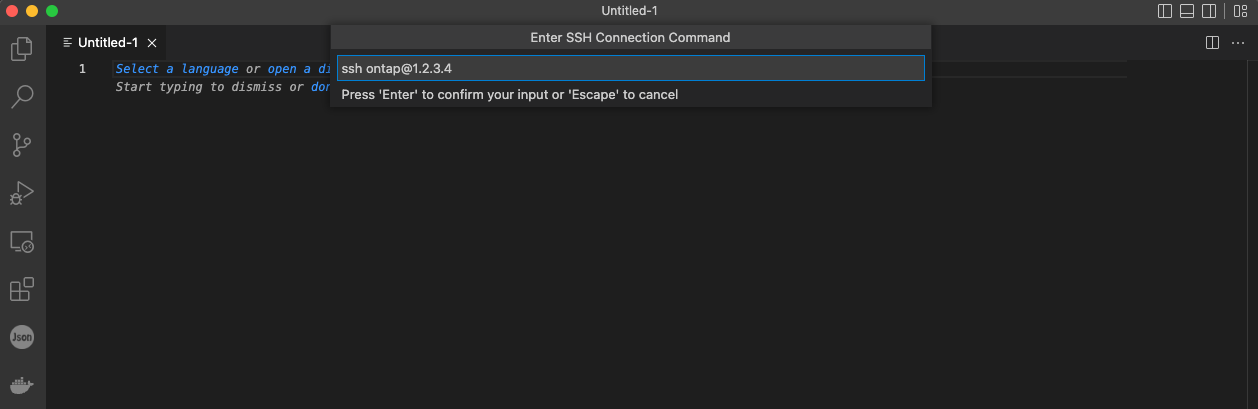
Enter “ssh [email protected]” being sure to replace the “1.2.3.4” with the actual IP address of your Cloud DX Server (which can be found on your onboarding email)…
-
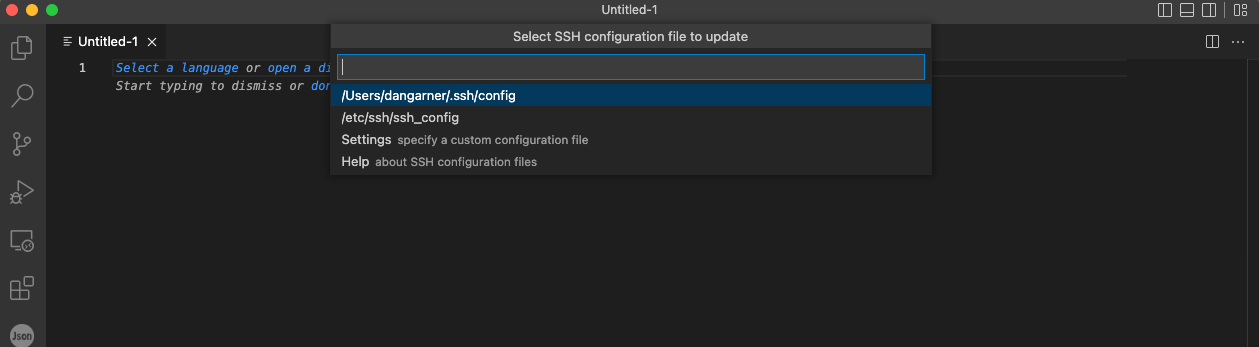
Select the configuration file to use…
-
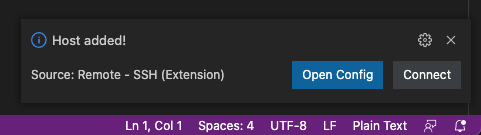
You should see in the bottom right corner…
-
Click the “Connect” button.
- A new window should open, and VS Code should connect to your Cloud DX Server.
- Because this is the first time this has been done, it will need to install the necessary software in your Cloud DX Server, and this can take a minute or so.
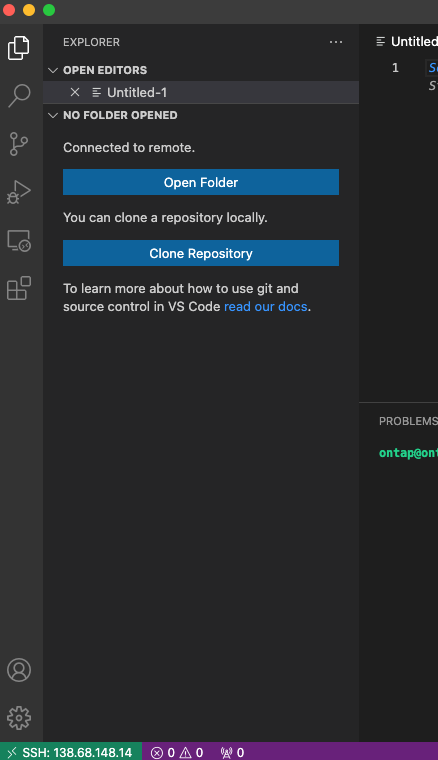
- When it has finished, the bottom left corner of your VS Code window will show the IP address, for example…
Configuring a project for Xdebug use
- You must insure that your project has a directory
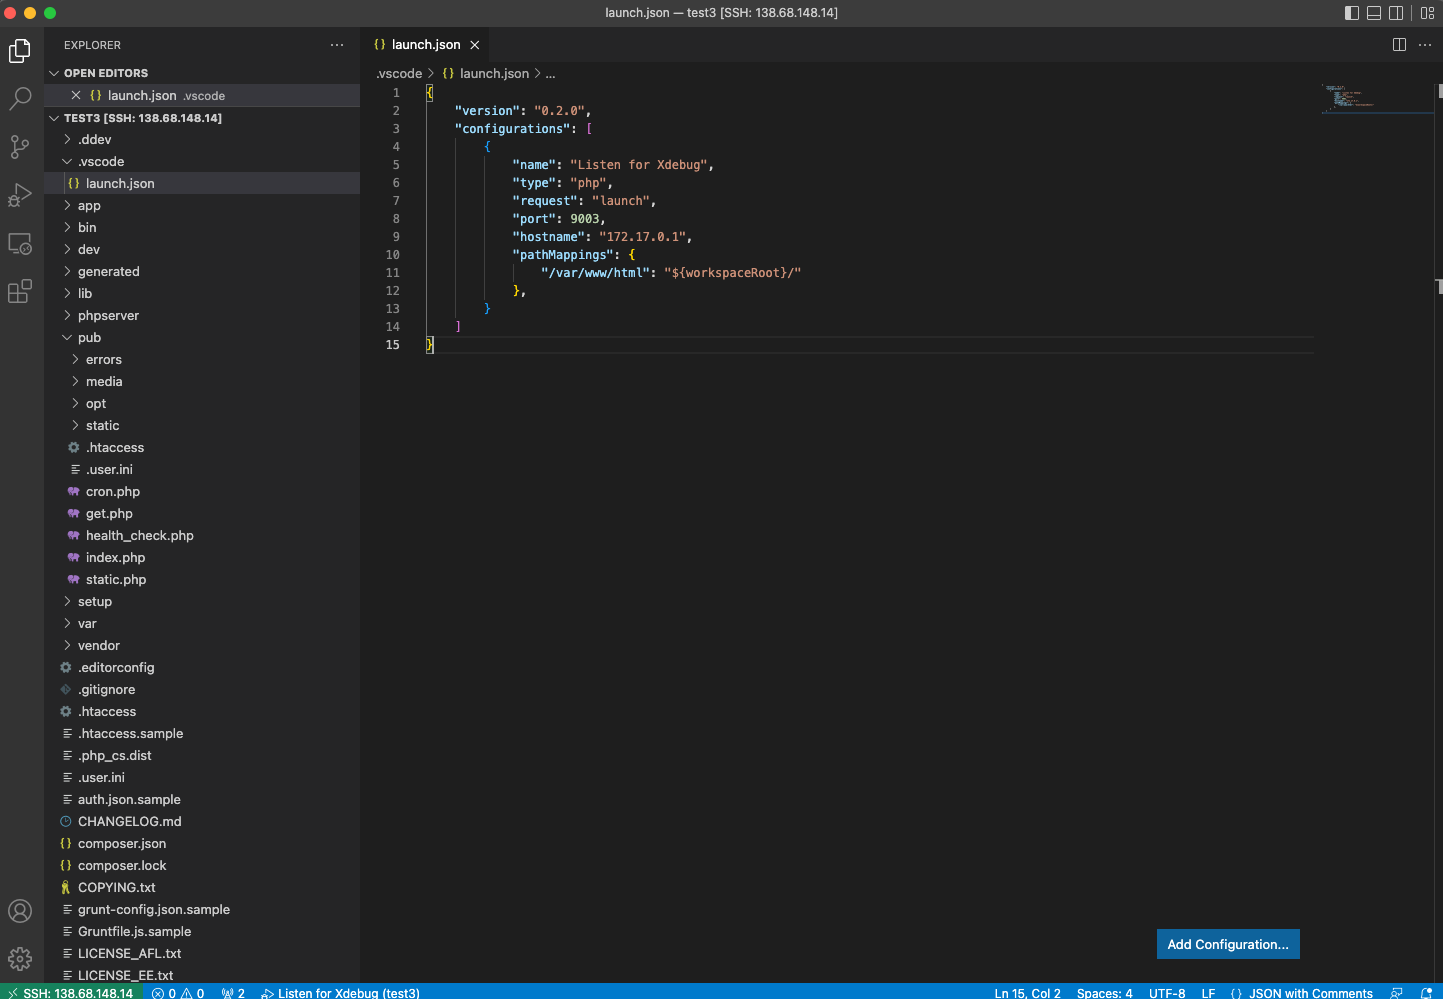
.vscodeat the project root. - Create a file
.vscode/launch.jsonthat contains the following content..{ "version": "0.2.0", "configurations": [ { "name": "Listen for Xdebug", "type": "php", "request": "launch", "port": 9003, "hostname": "172.17.0.1", "pathMappings": { "/var/www/html": "${workspaceRoot}/" }, } ] } -
You should then have something like this...
-
Open your project's .dx directory from VS Code, and create a new directory named
php. - Create a new file
.dx/php/vscode_remote.iniwith the following content...[PHP] xdebug.client_host=172.17.0.1 - Execute the command
dx restartwithin your project directory.
Using Xdebug
- Inside your project directory, execute the command
dx xdebug on. - You can start debugging by using the menu option Run → Start Debugging (also available on the keyboard shortcut F5).
- Now insert a breakpoint somewhere, for example in
pub/index.php...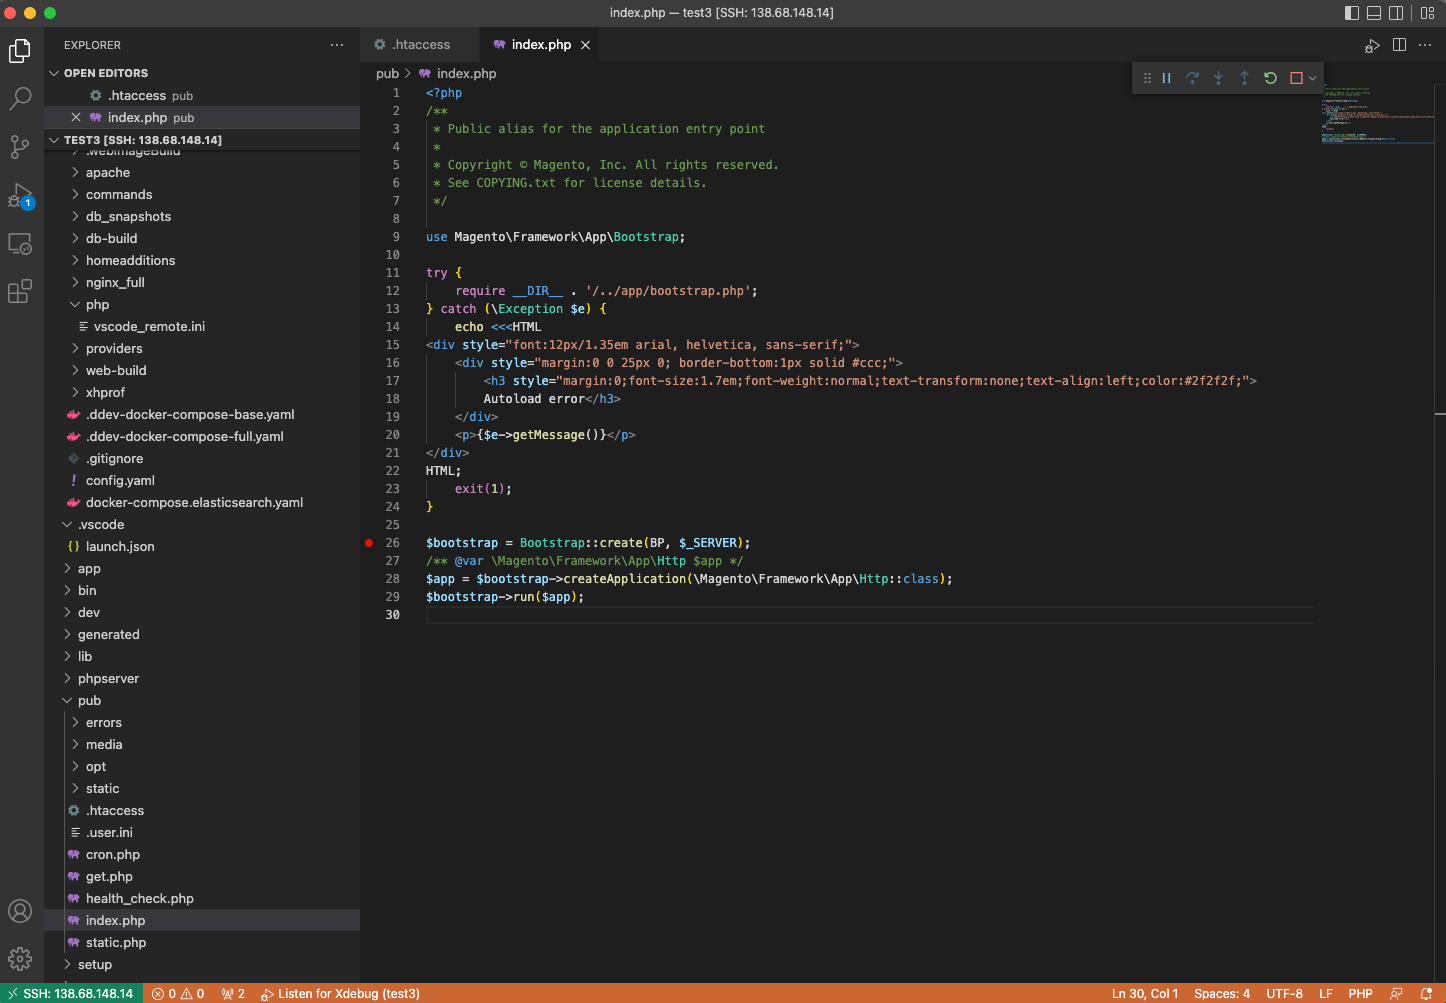 ... the orange bar shows you that debugging is enabled.
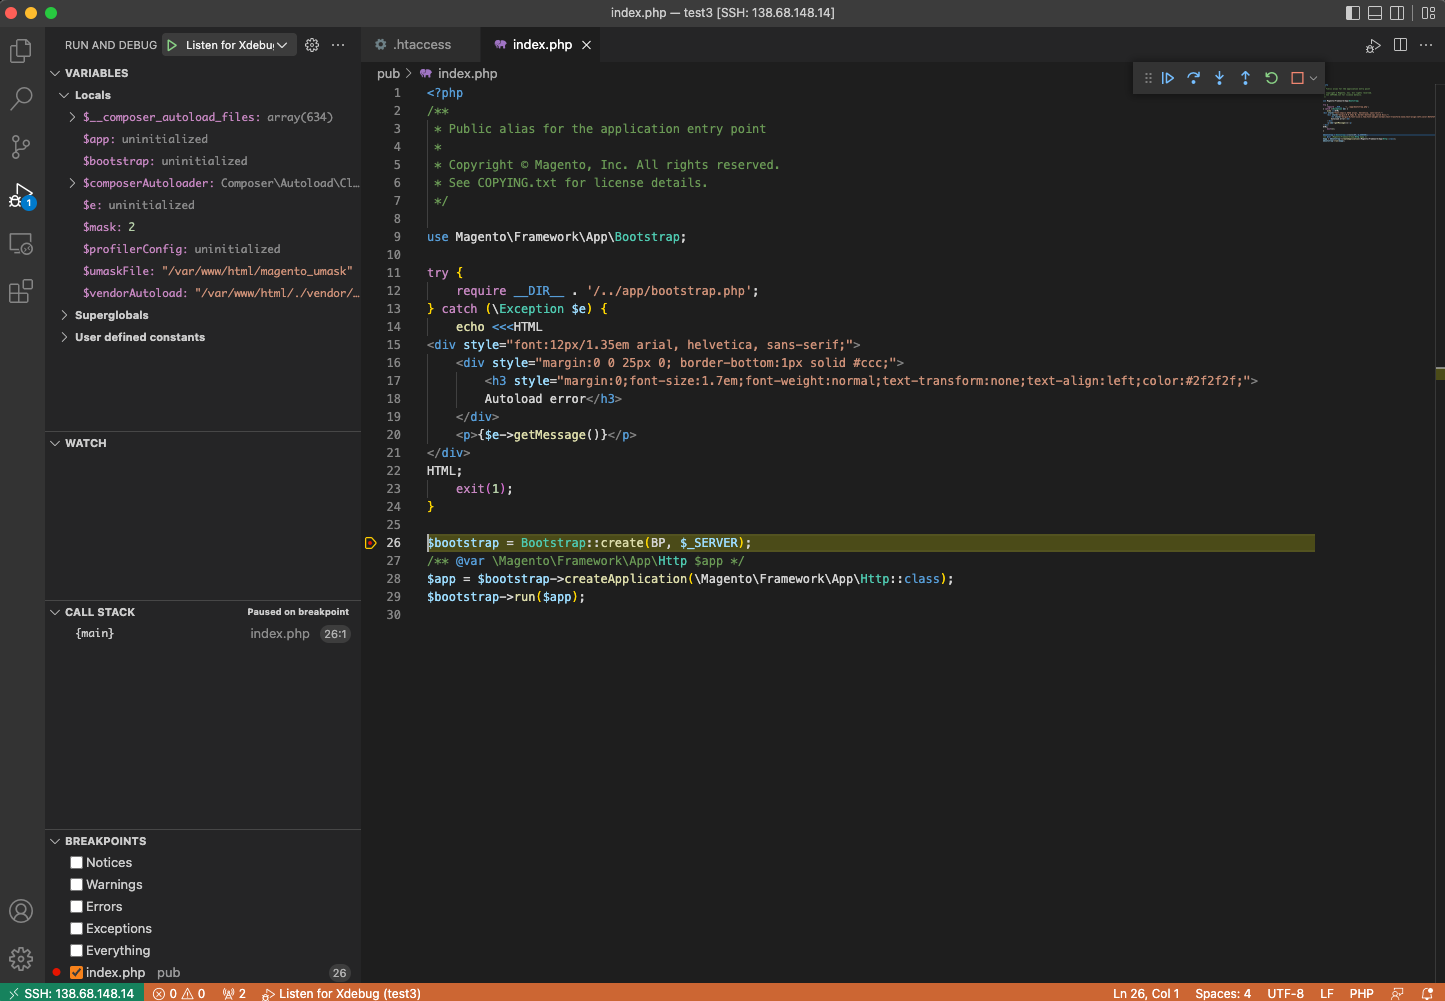
 - Now load up the website in your web browser.
- You should now see the code breakpoint has been triggered...
Turning Xdebug off
Performance is affected whilst Xdebug is enabled. Therefore, it is good practice to disable it when you do not need to debug. You can do that by executing the command dx xdebug off.